In this article, I will present a solution how to create a monitoring kubernetes(K8S) cluster for processing metrics and logs from multiple k8s clusters in one place.
I will use Istio as Service mash for encrypt communication and in Istio Ingress Gateway authorize requests sent from clients by issued mutual TLS by custom Certificate Authority (CA)
When you manage a few clusters, you need one place to check metrics and logs.
Your microservices generate metrics and prometheus pulls that data and save in local storage. This action is repeated on each cluster.
To preview those metrics you probably use grafana dashboards, but how to set prometheus from multiple clusters to save metrics in one place, and how to install logs collector for all nodes and save in one monitoring server?
Answer is simple, use Thanos for metrics, and Loki for logs.
Below I will present how to set up 3 clusters:
- Monitoring cluster with Thanos and Loki - collect metrics and logs
- Client cluster 0 - send metrics and logs to Monitoring cluster
- Client cluster 1 - send metrics and logs to Monitoring cluster
Diagram of our deployment
In above diagram you see 3 clusters. Monitoring cluster has Ingress Istio Gateway. What's i ingress? Ingress it's a gateway for all requests. In Istio Gateway request are decrypted, authenticate and route.
Clusters 0 and 1 have Promtail daemon and Prometheus pod with Thanos Sidecar. Promtail is installed on everyone nodes in Kubernetes cluster and send logs with mTLS to Loki Rest distributor on Monitoring Cluster through Istio Gateway. Istio Gateway check that TLS certificate is issue by local CA if yes pass request to Loki, otherwise drop connection.
On the other hand Thanos Sidecar installed in prometheus pod in Cluster 0 and 1, push metrics to Minio through Istio Ingress Gateway on Monitoring Cluster. Istio Gateway verify that request from Thanos Sidecar has issued TLS by Root CA.
Thanos on Monitoring Cluster query historical metrics from Minio and live metrics direct from Thanos Sidecar on Cluster-0 and Cluster-1. Requests are encrypted by mTLS pass through again Istio Gateway.
Above stack will be installed on local machine thanks to Kind (Kubernetes in docker). If you have a laptop with low memory please install it in a cloud instance. 16GB of memory is required.
All clusters will be installed in your machine. An environment will be emulated by docker.
Requirements software
Please check that you have installed below software. Below lists with versions which we tested this deployment
- docker 20.10.17, build 100c701
- kubectl v1.24.2
- kind v0.16.0
- helm v3.9.4
- helmfile v0.145.2
- kubectx - Change kubernetes context
- dasel - For parse yaml files
- git - For clone helm charts
All software are built in golang, so you can download simple binary file and start this tutorial.
1. System limits
For linux OS (Ubuntu or Docker) you have to increase limits. Without below lines you cannot install 3 virtual clusters in your machine.
#https://kind.sigs.k8s.io/docs/user/known-issues/
sudo sysctl fs.inotify.max_user_watches=524288
sudo sysctl fs.inotify.max_user_instances=512
2. Clone our blog github repository
Download prepared helm charts and change your console path
git clone https://github.com/gawsoftpl/gawsoft.com
cd blog/thanos-loki-istio-cluster/
2. Create clusters
If you create enviroment not in localhost but in cloud with load balancer. Skip this paragraph and got to Step 3 Prepare certificates for mTLS
2.1 Create clusters
Below commands will create two client clusters and main monitoring cluster. All in one machine thanks to docker container and kind(K8s in docker)
2.1.1 Create first client (cluster-0) This cluster will generate metrics, and push to monitoring cluster.
kind create cluster --config client/kind/kind-cluster.yaml --name=cluster-0
After 60 seconds you should have ready kubernetes cluster in docker container. For test execute below command
kubectl get pod -A --context kind-cluster-0
#Output:

#NAMESPACE            NAME                                              READY   STATUS    RESTARTS   AGE
#kube-system          coredns-565d847f94-k966x                          1/1     Running   0          4m58s
#kube-system          coredns-565d847f94-ml9b2                          1/1     Running   0          4m58s
#kube-system          etcd-cluster-1-control-plane                      1/1     Running   0          5m10s
#kube-system          kindnet-4jbnt                                     1/1     Running   0          4m53s
#kube-system          kindnet-92skm                                     1/1     Running   0          4m58s
#kube-system          kube-apiserver-cluster-1-control-plane            1/1     Running   0          5m10s
#kube-system          kube-controller-manager-cluster-1-control-plane   1/1     Running   0          5m12s
#kube-system          kube-proxy-2gtjd                                  1/1     Running   0          4m53s
#kube-system          kube-proxy-tn2xv                                  1/1     Running   0          4m58s
#kube-system          kube-scheduler-cluster-1-control-plane            1/1     Running   0          5m10s
#local-path-storage   local-path-provisioner-684f458cdd-d7wdn           1/1     Running   0          4m58s
2.1.2 Create second client (cluster-1) and monitoring cluster
And now we must repeat that command but with other parameters to create cluster-1 and monitoring cluster
# Create cluster-1
kind create cluster --config client/kind/kind-cluster.yaml --name=cluster-1

# Create monitoring cluster
kind create cluster --config monitoring-cluster/kind/kind-cluster.yaml
Check that all clusters are created:
kind get clusters
# Output:
# kind get clusters
# cluster-0
# cluster-1
# monitoring
Check that all pods are running, if not please wait 5-10 minutes. It depends on your internet connection speed to download pod container images.
kubectl get pod -A --context kind-cluster-0
kubectl get pod -A --context kind-cluster-1
kubectl get pod -A --context kind-monitoring
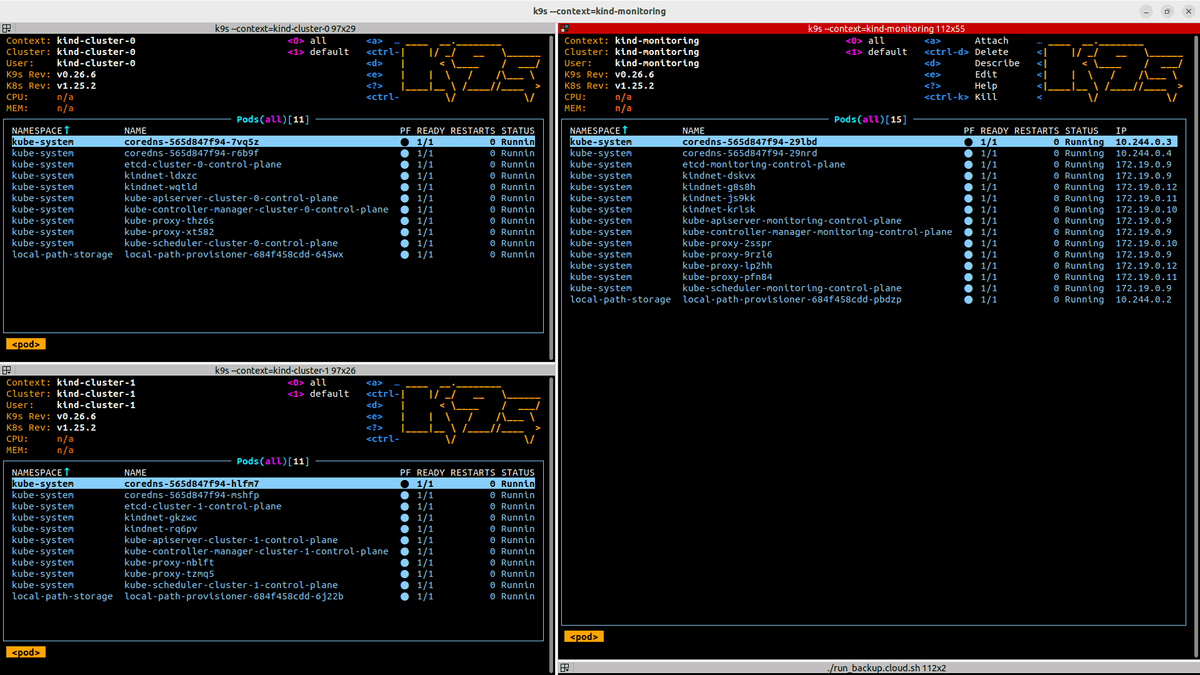
You can also run multiple view of 3 clusters in one window using tool like Terminator and k9s
k9s --context=kind-monitoring
k9s --context=cluster-0
k9s --context=cluster-1
2.2 Setup load balancer for ingress with MetalLB
Very important All below commands have to be run in the same terminal.
Because for communication you will use Istio Ingress with Load Balancer you should send requests to ingress endpoint, not to NodePort.
More info about difference between NodePort, Load Balancer you find here
For set up ingress load balancer in our local network you have to check network subnet for kind clusters.
KIND_SUBNET=`docker network inspect -f '{{range .IPAM.Config}}{{.Subnet}}{{end}}' kind`
echo $KIND_SUBNET
On my environment I have subnet: 172.19.0.0/16, but in yours it can be different so please run below commands to prepare endpoint for our clusters:
CLUSTER_0_IP=`bin/generate-ip-from-cidr.sh $KIND_SUBNET 135`
CLUSTER_1_IP=`bin/generate-ip-from-cidr.sh $KIND_SUBNET 136`
MONITORING_CLUSTER_IP=`bin/generate-ip-from-cidr.sh $KIND_SUBNET 137`
CLUSTER_0_ENDPOINT="${CLUSTER_0_IP}.nip.io"
CLUSTER_1_ENDPOINT="${CLUSTER_1_IP}.nip.io"
MONITORING_ENDPOINT="${MONITORING_CLUSTER_IP}.nip.io"

echo "Cluster-0 endpoint: $CLUSTER_0_ENDPOINT"
echo "Cluster-1 endpoint: $CLUSTER_1_ENDPOINT"
echo "Monitoring cluster endpoint: $MONITORING_ENDPOINT"

# Output:
# Cluster-0 endpoint: 172.19.0.135.nip.io
# Cluster-1 endpoint: 172.19.0.136.nip.io
# Monitoring cluster endpoint: 172.19.0.137.nip.io
What is nip.io? When clusters will start send request first will check dns for resolve ip.
Because we want to simplify things we will not set up dns server, for that I use dead simple wildcard DNS for any IP Address.
nip.io resolve host to specific ip: example:
dig prometheus.10.10.10.10.nip.io # -> resolve to 10.10.10.10
dig thanos.10.10.10.10.nip.io # -> resolve to 10.10.10.10
dig thanos.20.20.20.20.nip.io # -> resolve to 20.20.20.20
Install Load Balancer (MetalLB) on each clusters. Run this command in same terminal. ENV CLUSTER_0_IP, CLUSTER_1_IP and MONITORING_CLUSTER_IP will be applied
Cluster-0
kubectl --context kind-cluster-0 apply -f https://raw.githubusercontent.com/metallb/metallb/v0.13.5/config/manifests/metallb-native.yaml
kubectl --context kind-cluster-0 wait --for=condition=ready pod -l app=metallb -n metallb-system

cat <<EOF | kubectl apply --context kind-cluster-0  -f -
apiVersion: metallb.io/v1beta1
kind: IPAddressPool
metadata:
  name: example
  namespace: metallb-system
spec:
  addresses:
  - ${CLUSTER_0_IP}-${CLUSTER_0_IP}
---
apiVersion: metallb.io/v1beta1
kind: L2Advertisement
metadata:
  name: empty
  namespace: metallb-system
EOF
Cluster-1
kubectl --context kind-cluster-1 apply -f https://raw.githubusercontent.com/metallb/metallb/v0.13.5/config/manifests/metallb-native.yaml
kubectl --context kind-cluster-1 wait --for=condition=ready pod -l app=metallb -n metallb-system

cat <<EOF | kubectl apply --context kind-cluster-1  -f -
apiVersion: metallb.io/v1beta1
kind: IPAddressPool
metadata:
  name: example
  namespace: metallb-system
spec:
  addresses:
  - ${CLUSTER_1_IP}-${CLUSTER_1_IP}
---
apiVersion: metallb.io/v1beta1
kind: L2Advertisement
metadata:
  name: empty
  namespace: metallb-system
EOF
Monitoring-cluster
kubectl --context kind-monitoring apply -f https://raw.githubusercontent.com/metallb/metallb/v0.13.5/config/manifests/metallb-native.yaml
kubectl --context kind-monitoring wait --for=condition=ready pod -l app=metallb -n metallb-system

cat <<EOF | kubectl apply --context kind-monitoring  -f -
apiVersion: metallb.io/v1beta1
kind: IPAddressPool
metadata:
  name: example
  namespace: metallb-system
spec:
  addresses:
  - ${MONITORING_CLUSTER_IP}-${MONITORING_CLUSTER_IP}
---
apiVersion: metallb.io/v1beta1
kind: L2Advertisement
metadata:
  name: empty
  namespace: metallb-system
EOF
Great now you have ready 3 clusters with installed load balancer ready to serve requests via Ingress.
After this step our pods looks like this. All pods are running, Ip in your clusters can be different:

3. Prepare certificates for mTLS
Create directory for certificates
mkdir certs
3.1 Generate Certificate Authority (CA)
If you don't know what's a CA please read first 3 paragraphs from previous post: https://gawsoft.com/blog/mtls-how-to-setup-server-and-client-in-nodejs.html or watch youtube video:
https://www.youtube.com/watch?v=x_I6Qc35PuQ
For production you should use Intermediate CA and store Root CA in offline machine or use some PKI infrastructure for sign certificates. For this example we focus on how to set up kubernetes cluster with istio, thanos and loki to collect and authorize requests.
In real-life deployment, you have to install cert-manger and Hashicorp Vault, but that would be too much to start with for begin.
# Generate CA certificate, and CA key
openssl req -x509 -sha256 -nodes -days 365 -newkey rsa:2048 -subj '/O=example Inc./CN=example.com' -keyout certs/ca.key -out certs/ca.crt
Above CA keys we will use to issue tls certificate in cluster-0 and cluster-1. Monitoring server thanks to Istio will check that certificate is issued by our Root CA certificate, if not request will be rejected.
3.2 Create tls certificate and key for Cluster-0
Generate private key for Cluster-0 and prepare certificate sign request file.
cat<<EOF > certs/cluster-0-v3.ext
subjectKeyIdentifier   = hash
authorityKeyIdentifier = keyid:always,issuer:always
basicConstraints       = CA:TRUE
keyUsage               = digitalSignature, nonRepudiation, keyEncipherment, dataEncipherment, keyAgreement, keyCertSign
issuerAltName          = issuer:copy
subjectAltName         = DNS:prom-cluster.${CLUSTER_0_ENDPOINT}, DNS:*.nip.io
EOF
openssl req -out certs/cluster-0.csr -newkey rsa:2048 -nodes -keyout certs/cluster-0.key -subj "/CN=prom-cluster.${CLUSTER_0_ENDPOINT}/O=example organization"
Create certificate and issue with our CA root private key
openssl x509 -req -sha256 -days 365 -CA certs/ca.crt -CAkey certs/ca.key -set_serial 0 -in certs/cluster-0.csr -out certs/cluster-0.crt -extfile certs/cluster-0-v3.ext
Create certificate for promtail (service for send logs to monitoring cluster)
openssl req -out certs/cluster-0-promtail.csr -newkey rsa:2048 -nodes -keyout certs/cluster-0-promtail.key -subj "/CN=promtail-cluster-0/O=example organization"
openssl x509 -req -sha256 -days 365 -CA certs/ca.crt -CAkey certs/ca.key -set_serial 0 -in certs/cluster-0-promtail.csr -out certs/cluster-0-promtail.crt
Now our certs directory looks like that:
certs
├── ca.crt
├── ca.key
├── cluster-0.crt
├── cluster-0.csr
├── cluster-0.key
├── cluster-0-promtail.crt
├── cluster-0-promtail.csr
├── cluster-0-promtail.key
└── cluster-0-v3.ext
Validate that our cert is issue with CA
openssl verify -CAfile certs/ca.crt certs/cluster-0.crt
openssl verify -CAfile certs/ca.crt certs/cluster-0-promtail.crt
# Output:
# certs/cluster-0.crt: OK
# certs/cluster-0-promtail.crt: OK
3.2 Create tls certificate and key for Cluster-1 and Monitoring-Cluster
We have to repeat above step but for different CN (Common name)
Generate private key and certificate for Cluster-1
cat<<EOF > certs/cluster-1-v3.ext
subjectAltName         = DNS:prom-cluster.${CLUSTER_1_ENDPOINT}, DNS:*.nip.io
EOF
openssl req -out certs/cluster-1.csr -newkey rsa:2048 -nodes -keyout certs/cluster-1.key -subj "/CN=prom-cluster.${CLUSTER_1_ENDPOINT}/O=example organization"
openssl x509 -req -sha256 -days 365 -CA certs/ca.crt -CAkey certs/ca.key -set_serial 0 -in certs/cluster-1.csr -out certs/cluster-1.crt -extfile certs/cluster-1-v3.ext
Create certificate for promtail
openssl req -out certs/cluster-1-promtail.csr -newkey rsa:2048 -nodes -keyout certs/cluster-1-promtail.key -subj "/CN=promtail-cluster-1/O=example organization"
openssl x509 -req -sha256 -days 365 -CA certs/ca.crt -CAkey certs/ca.key -set_serial 0 -in certs/cluster-1-promtail.csr -out certs/cluster-1-promtail.crt
Generate private key and certificate for Monitoring-cluster
cat<<EOF > certs/cluster-monitoring-v3.ext
subjectAltName         = DNS:*.${MONITORING_ENDPOINT}, DNS:*.nip.io
EOF
openssl req -out certs/cluster-monitoring.csr -newkey rsa:2048 -nodes -keyout certs/cluster-monitoring.key -subj "/CN=*.${MONITORING_ENDPOINT}/O=example organization"
openssl x509 -req -sha256 -days 365 -CA certs/ca.crt -CAkey certs/ca.key -set_serial 0 -in certs/cluster-monitoring.csr -out certs/cluster-monitoring.crt -extfile certs/cluster-monitoring-v3.ext
Validate that our certs that are issued with CA
openssl verify -CAfile certs/ca.crt certs/cluster-1.crt
openssl verify -CAfile certs/ca.crt certs/cluster-1-promtail.crt
openssl verify -CAfile certs/ca.crt certs/cluster-monitoring.crt
# Output:
# certs/cluster-1.crt: OK
# certs/cluster-1-promtail.crt: OK
# certs/cluster-monitoring.crt: OK
4. Install helm charts
What we will build? Below you can see detailed schema of all components which will be used to build Central Monitoring Cluster.
Because for set up our clusters we will use multiple helm charts to make work easier I will use helmfile. This free software can declarative deploy Kubernetes manifests, Kustomize configs, and Charts as Helm releases in one shot.
What's a helmfile in on word? Install multiple helm charts from one file.
Special for this article I prepared helmile.yaml for each cluster.
client/helmfile/helmfile.yaml # For Cluster-0 and Cluster-1
monitoring-cluster/helmfile/helmfile.yaml
Directory "client" has all files that are required to start send metrics and logs from your client cluster. You can of course customize parameters.
All files are available in our github repo.
For add third cluster you should, but this is not required now.
- create new bucket in minio on monitoring cluster
- generate new tls cert and key
- issue new cert with Root CA
- install client/helmfile/helmfile.yaml
4.1 Installs helm charts in Cluster-0
Prepare secrets with:
- credentials to object storage (save metrics in example S3)
- mTLS certificate for authenticate (connection with loki ingress are encrypted, additional with mtls requests are authenticated)
Create namespaces:
kubectl --context kind-cluster-0 create ns monitoring || true
kubectl --context kind-cluster-0 create ns istio-system || true
Create secret for object bucket storage. This object bucket is installed on monitoring cluster
# Create secrets for you object bucket, where metrics will be stored
# This article is only tutorial so we don't encrypt traffic for minio
cat <<EOF | kubectl apply --context kind-cluster-0 -n monitoring -f -
apiVersion: v1
kind: Secret
metadata:
  name: cluster-objstore-secret
stringData:
  objstore.yml: |
    type: s3
    config:
      bucket: monitoring-cluster-0
      endpoint: minio.${MONITORING_ENDPOINT}:80
      access_key: admin
      secret_key: adminadmin
      insecure: true
EOF
Create secret with tls certificate for ingress thanos sidecar. That certificate is used to encrypt traffic and authorize by istio gateway when monitoring cluster will connect with Thanos sidecar.
# Create secret with certificate for sidecar to authorize request in monitoring cluster
kubectl create --context kind-cluster-0 -n istio-system \
secret generic thanos-sidecar-cluster-tls \
--from-file=tls.key=certs/cluster-0.key \
--from-file=tls.crt=certs/cluster-0.crt \
--from-file=ca.crt=certs/ca.crt
Create secret with certificate for promtail. That certificate is used to encrypt traffic and authorize in monitoring cluster.
# Create secret with certificate for promtail to authorize request in monitoring cluster
kubectl create --context kind-cluster-0 secret generic \
promtail-cluster-tls -n monitoring \
--from-file=tls-key=certs/cluster-0-promtail.key \
--from-file=tls-cert=certs/cluster-0-promtail.crt \
--from-file=ca-cert=certs/ca.crt
Now time for main process - install helm files, you have to set up required environment variables:
- LOKI_ENDPOINT - address where to send logs from promtail
- TENANT_ID - id of your client
During this process, pods will be restarted couple times.
kubectx kind-cluster-0
LOKI_ENDPOINT="https://loki.${MONITORING_ENDPOINT}/loki/api/v1/push" TENANT_ID="cluster-0" helmfile \
--kube-context kind-cluster-0 \
-f client/helmfile/helmfile.yaml sync
Wait for all pods be ready and verify installation:
kubectl get pod --context kind-cluster-0 -n monitoring
#Output:
#NAME                                                   READY   STATUS    RESTARTS      AGE
#prometheus-kube-prometheus-operator-768c4bcb68-67h8m   2/2     Running   1 (53s ago)   55s
#prometheus-kube-state-metrics-d4d674cb7-zxzg9          2/2     Running   2 (51s ago)   55s
#prometheus-prometheus-kube-prometheus-prometheus-0     4/4     Running   0             52s
#prometheus-prometheus-node-exporter-dtbxk              1/1     Running   0             54s
#prometheus-prometheus-node-exporter-kzmd8              1/1     Running   0             50s
#promtail-nlc7b                                         2/2     Running   0             24s
#promtail-rwp8w                                         2/2     Running   0             23s
Final step is create Istio Gateway and VirtualService. In our test project we will authorize requests by mTLS. Client have to send tls certificate issued by our CA.
cat <<EOF | kubectl apply --context kind-cluster-0 -f -
apiVersion: networking.istio.io/v1alpha3
kind: Gateway
metadata:
  name: nip-io
spec:
  selector:
    istio: gateway # use istio default controller
  servers:
    - port:
        number: 80
        name: http
        protocol: HTTP
      hosts:
        - "*.nip.io"
    - port:
        number: 443
        name: https
        protocol: HTTPS
      hosts:
        - "*.nip.io"
      tls:
        mode: MUTUAL # Setup mTLS for ingress gateway
        credentialName: thanos-sidecar-cluster-tls
---
apiVersion: networking.istio.io/v1alpha3
kind: VirtualService
metadata:
  name: thanos-sidecar
spec:
  gateways:
    - nip-io
  hosts:
    - "prom-cluster.${CLUSTER_0_ENDPOINT}"
  http:
    - name: "prometheus-sidecar-http"
      match:
        - uri:
            prefix: "/metrics"
      route:
        - destination:
            host: prometheus-kube-prometheus-thanos-discovery.monitoring.svc.cluster.local
            port:
              number: 10902

    - name: "prometheus-sidecar-grpc"
      match:
        - uri:
            prefix: "/"
      route:
        - destination:
            host: prometheus-kube-prometheus-thanos-discovery.monitoring.svc.cluster.local
            port:
              number: 10901
EOF
Check that thanos sidecar return code 200. This endpoint is without encryption and authenticate (Only for test, do not run this service in production)
curl -H "Host: prom-cluster.${CLUSTER_0_ENDPOINT}" \
    -s -o /dev/null -w "Return code: %{http_code}" \
    --resolve "prom-cluster.${CLUSTER_0_ENDPOINT}:80:${CLUSTER_0_IP}" \
    "http://prom-cluster.${CLUSTER_0_ENDPOINT}/metrics"
# Output:
# Return code: 200
Now time is for test grpc port with mTLS and authenticate. Should return http code 503
curl -H "Host: prom-cluster.${CLUSTER_0_ENDPOINT}" \
    -s -o /dev/null -w "Return code: %{http_code}" \
    --cacert certs/ca.crt --cert certs/cluster-monitoring.crt --key certs/cluster-monitoring.key \
    --resolve "prom-cluster.${CLUSTER_0_ENDPOINT}:443:${CLUSTER_0_IP}" \
    "https://prom-cluster.${CLUSTER_0_ENDPOINT}/"
# Output:
# Return code: 503
If you have problem with installation remove all helm charts and start from beginning. For destroy helmfile use command:
#kubectx kind-cluster-0
#LOKI_ENDPOINT="https://loki.${MONITORING_ENDPOINT}/loki/api/v1/push" TENANT_ID="cluster-0" helmfile \
#--kube-context kind-cluster-0 \
#-f client/helmfile/helmfile.yaml destroy
4.2 Install helm charts in Cluster-1
We have to run same operations as in previous step but with different values
kubectl --context kind-cluster-1 create ns monitoring || true
kubectl --context kind-cluster-1 create ns istio-system || true
cat <<EOF | kubectl apply --context kind-cluster-1 -n monitoring -f -
apiVersion: v1
kind: Secret
metadata:
  name: cluster-objstore-secret
stringData:
  objstore.yml: |
    type: s3
    config:
      bucket: monitoring-cluster-1
      endpoint: minio.${MONITORING_ENDPOINT}:80
      access_key: admin
      secret_key: adminadmin
      insecure: true
EOF
# Create secret with certificate for sidecar to authorize request in monitoring cluster
kubectl create --context kind-cluster-1 -n istio-system \
secret generic thanos-sidecar-cluster-tls \
--from-file=tls.key=certs/cluster-1.key \
--from-file=tls.crt=certs/cluster-1.crt \
--from-file=ca.crt=certs/ca.crt
# Create secret with certificate for promtail to authorize request in monitoring cluster
kubectl create --context kind-cluster-1 secret generic \
promtail-cluster-tls -n monitoring \
--from-file=tls-key=certs/cluster-1-promtail.key \
--from-file=tls-cert=certs/cluster-1-promtail.crt \
--from-file=ca-cert=certs/ca.crt
kubectx kind-cluster-1
LOKI_ENDPOINT="https://loki.${MONITORING_ENDPOINT}/loki/api/v1/push" TENANT_ID="cluster-1" helmfile \
--kube-context kind-cluster-1 \
-f client/helmfile/helmfile.yaml sync
cat <<EOF | kubectl apply --context kind-cluster-1 -f -
apiVersion: networking.istio.io/v1alpha3
kind: Gateway
metadata:
  name: nip-io
spec:
  selector:
    istio: gateway # use istio default controller
  servers:
    - port:
        number: 80
        name: http
        protocol: HTTP
      hosts:
        - "*.nip.io"
    - port:
        number: 443
        name: https
        protocol: HTTPS
      hosts:
        - "*.nip.io"
      tls:
        mode: MUTUAL # Setup mTLS for ingress gateway
        credentialName: thanos-sidecar-cluster-tls
---
apiVersion: networking.istio.io/v1alpha3
kind: VirtualService
metadata:
  name: thanos-sidecar
spec:
  gateways:
    - nip-io
  hosts:
    - "prom-cluster.${CLUSTER_1_ENDPOINT}"
  http:
    - name: "prometheus-sidecar-http"
      match:
        - uri:
            prefix: "/metrics"
      route:
        - destination:
            host: prometheus-kube-prometheus-thanos-discovery.monitoring.svc.cluster.local
            port:
              number: 10902

    - name: "prometheus-sidecar-grpc"
      match:
        - uri:
            prefix: "/"
      route:
        - destination:
            host: prometheus-kube-prometheus-thanos-discovery.monitoring.svc.cluster.local
            port:
              number: 10901
EOF
Now time is for test grpc port with mTLS and authenticate. Should return http code 503
curl -H "Host: prom-cluster.${CLUSTER_1_ENDPOINT}" \
    -s -o /dev/null -w "Return code: %{http_code}" \
    --cacert certs/ca.crt --cert certs/cluster-monitoring.crt --key certs/cluster-monitoring.key \
    --resolve "prom-cluster.${CLUSTER_1_ENDPOINT}:443:${CLUSTER_1_IP}" \
    "https://prom-cluster.${CLUSTER_1_ENDPOINT}/"
4.3 Set up helm charts for Monitoring Cluster (main cluster)
Time for final process. Now we will install Main cluster for collect all metrics and logs. All clusters will be connect with that environment.
4.3.1 Install charts
kubectl --context kind-monitoring create ns storage || true
kubectl --context kind-monitoring create ns istio-system || true
kubectl --context kind-monitoring create ns clients || true
4.3.2 Create secret for object storage
On cluster-0 and cluster-1 thanos sidecar push metrics to Object Storage.
So we have to create secrets with credentials for that S3.
Because Our S3 in hosted in same cluster we just set as endpoint local service endpoint.
cat <<EOF | kubectl apply --context kind-monitoring -n clients -f -
apiVersion: v1
kind: Secret
metadata:
  name: cluster-0-objstore-secret
stringData:
  objstore.yml: |
    type: s3
    config:
      bucket: monitoring-cluster-0
      endpoint: "minio.storage.svc.cluster.local:9000" # K8s local endpoint
      access_key: admin
      secret_key: adminadmin
      insecure: true
---
apiVersion: v1
kind: Secret
metadata:
  name: cluster-1-objstore-secret
stringData:
  objstore.yml: |
    type: s3
    config:
      bucket: monitoring-cluster-1
      endpoint: "minio.storage.svc.cluster.local:9000" # K8s local endpoint
      access_key: admin
      secret_key: adminadmin
      insecure: true
---
EOF
Now our Thanos Query from Cluster-Monitor will send requests to:
- Cluster-0 Thanos Sidecar
- Cluster-1 Thanos Sidecar
So we need to set tls for Thanos Query Cluster-0, and Thanos Query Cluster-1
# Create secret with certificate for sidecar to authorize request in monitoring cluster
kubectl create --context kind-monitoring -n clients \
secret generic thanos-query-cluster-0 \
--from-file=tls-key=certs/cluster-monitoring.key \
--from-file=tls-cert=certs/cluster-monitoring.crt \
--from-file=ca-cert=certs/ca.crt

kubectl create --context kind-monitoring -n clients \
secret generic thanos-query-cluster-1 \
--from-file=tls-key=certs/cluster-monitoring.key \
--from-file=tls-cert=certs/cluster-monitoring.crt \
--from-file=ca-cert=certs/ca.crt
In our cluster we host loki gateway, which is also encrypted and required authenticate. Please add secret for istio ingress.
# Create secret with certificate for sidecar to authorize request in monitoring cluster
kubectl create --context kind-monitoring -n istio-system \
secret generic wildcard-endpoint \
--from-file=tls.key=certs/cluster-monitoring.key \
--from-file=tls.crt=certs/cluster-monitoring.crt \
--from-file=ca.crt=certs/ca.crt
We added all required secrets now time for install helm charts: Very important for set THANOS_SIDECAR_ENDPOINT, Do not add https://, as endpoint you set GRPC endpoint.
4.3.3 Install Helm charts
kubectx kind-monitoring
export CLUSTER_0_THANOS_SIDECAR_ENDPOINT="prom-cluster.${CLUSTER_0_ENDPOINT}:443"
export CLUSTER_1_THANOS_SIDECAR_ENDPOINT="prom-cluster.${CLUSTER_1_ENDPOINT}:443"
helmfile \
--kube-context kind-monitoring \
-f monitoring-cluster/helmfile/helmfile.yaml sync
If you have problem with install remove deployment and start from beginning
#kubectx kind-monitoring
#export CLUSTER_0_THANOS_SIDECAR_ENDPOINT="prom-cluster.${CLUSTER_0_ENDPOINT}:443"
#export CLUSTER_1_THANOS_SIDECAR_ENDPOINT="prom-cluster.${CLUSTER_1_ENDPOINT}:443"
#helmfile \
#--kube-context kind-monitoring \
#-f monitoring-cluster/helmfile/helmfile.yaml destroy
4.3.4 Install Istio manifests
Create loki gateway vi Istio encrypted with mTLS and non encrypted minio endpoint. Minio will server on normal port 80, loki on 443.
cat <<EOF | kubectl apply --context kind-monitoring -n loki -f -
apiVersion: networking.istio.io/v1alpha3
kind: Gateway
metadata:
  name: loki
spec:
  selector:
    istio: gateway # use istio default controller
  servers:
    - port:
        number: 443
        name: https
        protocol: HTTPS
      hosts:
        - "loki.${MONITORING_ENDPOINT}"
      tls:
        mode: MUTUAL # Setup mTLS for ingress gateway
        credentialName: wildcard-endpoint
---
apiVersion: networking.istio.io/v1alpha3
kind: VirtualService
metadata:
  name: loki
spec:
  gateways:
    - loki
  hosts:
    - "loki.${MONITORING_ENDPOINT}"
  http:
    - name: "loki"
      match:
        - uri:
            prefix: "/"
      route:
        - destination:
            host: loki-loki-distributed-distributor.loki.svc.cluster.local
            port:
              number: 3100
EOF
cat <<EOF | kubectl apply --context kind-monitoring -n thanos -f -
apiVersion: networking.istio.io/v1alpha3
kind: Gateway
metadata:
  name: minio
spec:
  selector:
    istio: gateway # use istio default controller
  servers:
    - port:
        number: 80
        name: http
        protocol: HTTP
      hosts:
        - "minio.${MONITORING_ENDPOINT}"
        - "dashboard-minio.${MONITORING_ENDPOINT}"
      tls:
        httpsRedirect: false
---
apiVersion: networking.istio.io/v1alpha3
kind: VirtualService
metadata:
  name: minio
spec:
  gateways:
    - minio
  hosts:
    - "minio.${MONITORING_ENDPOINT}"
  http:
    - name: "minio"
      match:
        - uri:
            prefix: "/"
      route:
        - destination:
            host: minio.storage.svc.cluster.local
            port:
              number: 9000
---
apiVersion: networking.istio.io/v1alpha3
kind: VirtualService
metadata:
  name: minio-dashboard
spec:
  gateways:
    - minio
  hosts:
    - "dashboard-minio.${MONITORING_ENDPOINT}"
  http:
    - name: "miniodashboard"
      match:
        - uri:
            prefix: "/"
      route:
        - destination:
            host: minio.storage.svc.cluster.local
            port:
              number: 9001

EOF
4.3.5 Verify installation
Test minio, should return error code: 403.
curl -H "Host: minio.${MONITORING_ENDPOINT}" \
    -s -o /dev/null -w "Return code: %{http_code}" \
    "http://minio.${MONITORING_ENDPOINT}/"
Test loki ingress, should return 405
curl -H "Host: loki.${MONITORING_ENDPOINT}" \
    -s -o /dev/null -w "Return code: %{http_code}" \
    --cacert certs/ca.crt --cert certs/cluster-0.crt --key certs/cluster-0.key \
    --resolve "loki.${MONITORING_ENDPOINT}:443:${MONITORING_CLUSTER_IP}" \
    "https://loki.${MONITORING_ENDPOINT}/loki/api/v1/push"
Final list of pods in Monitoring clusters looks like this:
kubectl --context kind-monitoring get pod -A
# Output:
#NAMESPACE            NAME                                                    READY   STATUS    RESTARTS      AGE
#clients              cluster-0-thanos-bucketweb-84f587fbf4-d7wzb             1/1     Running   0             13m
#clients              cluster-0-thanos-compactor-6766f65585-g52wm             1/1     Running   2 (13m ago)   13m
#clients              cluster-0-thanos-query-67fcff756c-2h8z8                 1/1     Running   0             13m
#clients              cluster-0-thanos-query-frontend-7dbfb868cf-9q6v9        1/1     Running   0             13m
#clients              cluster-0-thanos-storegateway-0                         1/1     Running   3 (13m ago)   13m
#clients              cluster-1-thanos-bucketweb-769ff88849-fkbvz             1/1     Running   0             13m
#clients              cluster-1-thanos-compactor-695b4cf855-4n494             1/1     Running   2 (13m ago)   13m
#clients              cluster-1-thanos-query-6f958cf8fd-2ss5f                 1/1     Running   0             13m
#clients              cluster-1-thanos-query-frontend-64fc7f44d8-w24bq        1/1     Running   0             13m
#clients              cluster-1-thanos-storegateway-0                         1/1     Running   3 (13m ago)   13m
#istio-system         istio-gateway-5ff4dc958-pbjg4                           1/1     Running   0             2m29s
#istio-system         istiod-6bdff644fd-5tvgd                                 1/1     Running   0             13m
#kube-system          coredns-565d847f94-np7cw                                1/1     Running   0             10h
#kube-system          coredns-565d847f94-ts42m                                1/1     Running   0             10h
#kube-system          etcd-monitoring-control-plane                           1/1     Running   0             10h
#kube-system          kindnet-m5gdt                                           1/1     Running   0             10h
#kube-system          kindnet-pznbn                                           1/1     Running   0             10h
#kube-system          kindnet-z5vr4                                           1/1     Running   0             10h
#kube-system          kube-apiserver-monitoring-control-plane                 1/1     Running   0             10h
#kube-system          kube-controller-manager-monitoring-control-plane        1/1     Running   0             10h
#kube-system          kube-proxy-jjq8m                                        1/1     Running   0             10h
#kube-system          kube-proxy-vbc27                                        1/1     Running   0             10h
#kube-system          kube-proxy-zp7h4                                        1/1     Running   0             10h
#kube-system          kube-scheduler-monitoring-control-plane                 1/1     Running   0             10h
#local-path-storage   local-path-provisioner-684f458cdd-kffwj                 1/1     Running   0             10h
#loki                 loki-loki-distributed-distributor-6f47cd4d84-qgt9c      1/1     Running   0             13m
#loki                 loki-loki-distributed-ingester-0                        1/1     Running   0             13m
#loki                 loki-loki-distributed-querier-0                         1/1     Running   0             13m
#loki                 loki-loki-distributed-query-frontend-58478d9844-twhb2   1/1     Running   0             13m
#metallb-system       controller-8689779bc5-mfhmg                             1/1     Running   0             9h
#metallb-system       speaker-7xfbb                                           1/1     Running   0             9h
#metallb-system       speaker-ch27k                                           1/1     Running   0             9h
#metallb-system       speaker-cmq8m                                           1/1     Running   0             9h
#monitoring           prometheus-grafana-5c969f576d-47zjc                     4/4     Running   0             8m34s
#storage              minio-57655695b9-zrsq8                                  2/2     Running   0             13m
#thanos               redis-master-0                                          2/2     Running   0             2m32s
#thanos               thanos-query-85f9bfbd84-9sgf5                           2/2     Running   0             2m37s
#thanos               thanos-query-frontend-59b79dd4d7-2kq2j                  2/2     Running   0             2m37s
Go to thanos query service to check that all graph has green color with label UP. First create port-forward:
kubectl port-forward svc/thanos-query -n thanos 9090:9090
Open browser and visit page: http://localhost:9090, click on Tab Stores You should see image like this. If everything is green installation of clusters is completed

6. Execute tests
Run loki Canary on each clusters. This small service will generate logs.
6.1 Test loki
kubectl --context kind-cluster-0 apply -f tests/loki-canary.yml
kubectl --context kind-cluster-1 apply -f tests/loki-canary.yml
6.2 Test Thanos
I create bash script for thanosbench to auto generate prometheus block and upload to pod via S3:
# Generate samples metrics and load to prometheus in cluster-0
bin/generate-datas.sh kind-cluster-0 cluster-0
bin/load-datas.sh kind-cluster-0 cluster-0

# Generate samples metrics and load to prometheus in cluster-1
bin/generate-datas.sh kind-cluster-1 cluster-1
bin/load-datas.sh kind-cluster-1 cluster-1
6.3 Run Grafana
Now time to final process. Run grafana for query Logs and Metrics. First create port-forward for grafana service:
kubectl port-forward svc/prometheus-grafana -n monitoring 3000:80
Go in browser to address http://localhost:3000 and login with default credentials:
user: admin
password: prom-operator
In helm files I prepare that grafana will have arleady installed data-source for Cluster-0, Cluster-1 and for overall Thanos View, also loki source will be set up, so you don't have to do anything.


Watch video from grafana:

Conclusion
Above I present how to set up one monitoring cluster for all clusters in our company. All traffic from Thanos Sidecar to Thanos query are encrypted by mutual TLS. For that I used Istio service mesh.
I did not encrypt traffic to minio, because in production you will use AWS, Google, Azure or Wasabi Object Storage. Additional secrets and certificates would be created problems for users who begin a journey with K8S. For test we only encrypt and authenticate traffic to thanos sidecar and loki distributor.
As you can see a lot of trouble are signing certificates and create new secrets. In real world deployment you should Use PKI (Public Key Infrastructure) with Cert Manager. For PKI you can use Hashicorp Vault or AWS Private Certificate Authority.
That infrastructure with Istio and Cert Manager would be generate a short-lived certificate and auto issue with Intermediate CA by Cert Manager. More about Intermediate mtl you can read in our blog: here
See example image:
Now you can install Alert Manager and create rules, but for that you have to do by own.
Cleanup
Remove test clusters
kind delete cluster --name=monitoring
kind delete cluster --name=cluster-0
kind delete cluster --name=cluster-1